
My Android app FuncXY
FuncXY is an application to plot 3D graphs of functions of two variables. In the simplest case, these variables are the Cartesian coordinates x and y.
Version 2.00 introduced cylindrical coordinates theta and r as an alternative.
Another extension, the use of spherical coordinates theta and phi, became available in version 2.03.
Version 2.06 also supports parametric surfaces.
Finally, conditional expressions were introduced in version 2.07.
You can enter the formulas for the functions you want to plot, using a special soft keyboard designed for this app.
Such a formula must be an expression in two variables, for which you now have four options, depending on the type of coordinates:
Cartesian coordinates x and y, or
cylindrical coordinates theta and r, or
spherical coordinates theta and phi, or
parametric surfaces with coordinates u and v, in which not a single function but rather x, y and z are expressed.
You can use the arithmetical operators + - * / and ^ (for exponentiation).
Parentheses can occur as usual. Blank spaces are allowed.
The minimum and maximum values of the two variables must be supplied.
In the case of syntax errors or division by zero, the expression is not accepted.
As you enter a formula based on Cartesian, cylindrical or sperical coordinates, it is displayed in more readable notation just above the text you are entering or editing.
The function surface can be viewed from any viewpoint.
There are buttons to change the viewpoint but you can also change the viewing direction by swiping the image, that is,
by moving your finger on the screen either horizontally or vertically.
You can also specify the viewing direction by entering two angles phiE and thetaE, as illustrated in the app itself.
In the 3D image, you can display or hide the coordinate axes as you like, either by checking a checkbox on the choice screen or by touching a button beside the image.
When the image is shown, pressing the back key causes the edit screen to appear again. Pressing the back key once again causes the choice screen to appear.
The following functions, well-known in mathematics or programming, are supported:
abs, floor, ceil, exp, log, max, min, sin, cos, tan, asin, acos, atan, sqrt.
You can also use the constant pi.
Arguments must be surrounded by parentheses. For example, sin(x), not sin x. As usual, max and min take two arguments, the others take one. Note the restricted domains of some of these functions:
log(x): x positive;
tan(x): x not equal to pi/2 (plus any multiple of pi);
asin(x), acos(x): x between -1 and +1 (inclusive).
For each of the four coordinate types, there are some examples available in the options menu.
When you choose an example, the required type of coordinates is chosen automatically,
so you need not bother about this choice. Some of these examples show the coordinate axes while other hide them.
As mentioned above, the checkbox on the choice screen and the show/hide button on the image screen enable you to show or hide these axes as you like.
The specified functions can be saved and retrieved later.
The following data are then also automatically saved and retrieved: the coordinate intervals,
the viewpoint parameters phiE and thetaE, and the state of the checkbox for displaying the axes.
In version 2.07 and higher, conditional expressions are supported.
These are well-known in programming languages and have the form
logical expression ? expression1 : expression2.
This means
if logical expression is true then expression1 else expression2.
For example, the expression
max(x, y)
could be written as the conditional expression
(x > y ? x : y).
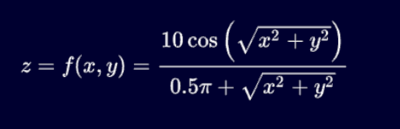
In version 2.10 and higher, the app also displays formulas in mathematical notation. For example, when the user enters the text
10 * cos(sqrt(x^2 + y^2))/
(0.5 * pi + sqrt(x^2 + y^2))
(used in the built-in example 1), the following more readable mathematical equivalent is displayed above this text:
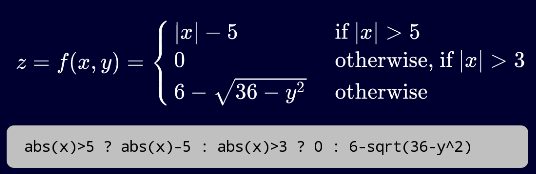
Similarly, the editable text
abs(x)>5 ? abs(x)-5 : abs(x)>3 ? 0 : 6-sqrt(36-y^2)
of example 2 is automatically displayed in mathematical style, as the following screenshot shows:
By the way, the image shown at the top of this webpage will appear when the OK button is now touched.
Besides '?' and ':', the following characters can now also be used: '<', '>', '=', '&', '|', '!'.
You can use '=' or, as in real programming languages, '==' to test if two expressions are equal.
Similarly, '&' and '|' (meaning 'and' and 'or') can appear single or double, with the same meaning.
The exclamation mark '!' stands for 'not'. Therefore,
x > y
can, rather clumsily, also be written
!(x <= y).
Similarly,
!(x == y)
is equivalent to
x != y,
both denoting that x is unequal to y.
This video shows how a function similar to the above example 2 is entered and how its image is viewed from various viewpoints: