|
_][_ [_Overview_] [_Top 50_] [_PB Signal Ratio_] [_PB Score_] [_Odd Ones_] [_Gaussians?_] [_Contributing_]
|
|
Advanced Search... ©
|

|
What gaussians are:
In the context of SETI@home, 'gaussians' are signals that increase and then decrease in strength as the telescope moves across the sky.
Technically, a gaussian is a mathematical function commonly describing the sort of distribution of values you get around the nominal value of some property as a result of measurement. In case of SETI@home, the measuring of a signal's strength.
It is often described as a bell curve, as it starts off rising slowly, then accelerates before starting to level off and come down in a mirror image of its rise. It looks something like the cross section of a church bell.
For SETI@home, it means that if an ideal signal is sent from a distant planet, it will be seen on Earth as having a bell shape as the Arecibo telescope's focus sweeps across the sky. When the telescope's field of view approaches the source star, the signal will go up and then down again as the telescope moves away. Note that gaussians can also be produced by earthly interference, but generally an earthbound signal would not get louder and then softer over the 12 second period we are interested in.
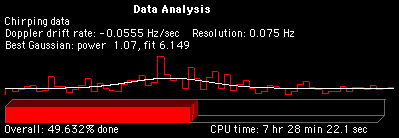
Here is a typical gaussian graph which shows the familiar red "skyline" graph that represents the power at a given frequency as seen over time. The white line shows the gaussian that best fits the "skyline". You can think of the peak power as the "height" of the bump, and the fit as the "distance" between the red and white lines (the gaussian fit value is actually the chi-squared statistic). The drift rate frequency and resolution bandwidth at which the signal is being analyzed are also shown in the 'Data Analysis' window of the SETI@home client.
The client software only shows the best gaussian found so far and bases this solely on the score it has. This value is also stored in the file 'state.sah' and used by many add-on programs, like SETISpy or SETIMonitor, that often show more detailed information about the gaussians.
A gaussian's score is calculated as:
Score = Power / Fit
Score doesn't say anything about the quality of the signal and doesn't determine if it gets reported in the file that is returned to Berkeley when the workunit is completed. See the SETI-NG-FAQ, section 2.24 for details on that.
Also, it is not enough for determining if a gaussian can be considered 'interesting', since its power might be way too low. SETI@home has determined an interesting region for the gaussians.
To be reported as 'interesting' by SETISpy, a gaussian must have a certain fit value:
(Fit < 2 + 8/5 * Power) AND (Fit < 8.8)
The add-on program SETISpy will show a green dot on its skymap and add 'interesting' to the log if this is the case.
Remember that this doesn't mean that ET has been found. More precise analysis on much more data from the same location is required before conclusions can be drawn. And that conclusion will most likely be 'earthly interference'.
![]()